
To explain Network Monitoring, SNMP and its evolution, we have to go back a couple of decades ago, where the first data networks started to become popular and spread around the world. In these early days, a couple of administrators could manually maintain a company’s entire network infrastructure. In those years, networks were made up of few computers, so the complexity of services and users hardly existed.
From approximately 2000, computers, the Internet and all technology began to change the way we work and relate. A multitude of services were developed in what we called convergent networks (capable of transporting data, voice, video …). These infrastructures went from few users and little criticality, to millions of users and increasingly critical systems, where unavailability was not an option.
It was from that moment that the monitoring systems began to be essential tools, which facilitated the administrators work, being able to anticipate critical incidents in the service and identifying any failure before it happened.
Nowadays managing a network infrastructure without a good monitoring system is almost unthinkable. Monitoring, apart from notifying us incidents and falls, provides us with a lot of useful information to minimize response times and to be able to identify and correct faults, before they cause services or users outage.
Most monitoring systems are based on the SNMP (Simple Network Management Protocol), this protocol has lasted for many years, evolving from its first version to SNMPv3.
SNMP PROTOCOL
To try to simplify, SNMP is a protocol that is developed at the application layer and facilitates the exchange of equipment status information to an SNMP manager (NMS). It uses two UDP ports (161 and 162).
Basically in SNMP there are two types of devices, the server and the agent:
- Server (NMS). It is the computer that collects and saves all SNMP data from the agents or end devices. This server can poll agents, requesting information about their status. He is also in charge of receiving the alarms or traps from the agents.
- An agent is a service that is installed on the end devices and is in charge of attending to the requests made by the server or sending a trap when an event occurs.
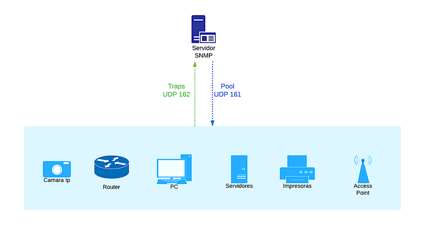
SNMP operation ilustration
Due to the large number of devices that use SNMP, we can monitor from PCs, servers, printers … to the latest technology in sensors, IoT devices and industrial environment devices.
In order to meet this great challenge, SNMP has to be able to interpret any data and make it readable by administrators. For example, a printer can send us a trap when it is running out of ink or paper and a router can send it when an interface is having errors or discards; the SNMP manager must be able to interpret both data.
SNMP uses small databases where each information that can be sent or received is described and detailed. These databases are called MIB (Management Information Base) and contain hierarchically organized information. For an SNMP manager and an agent to understand each other, they must both have the same MIB’s.
Within each MIB, Object Identifiers (OIDs) are defined. These identifiers define what values and information they can have and share. To understand it better, let’s take a look at a MIB.
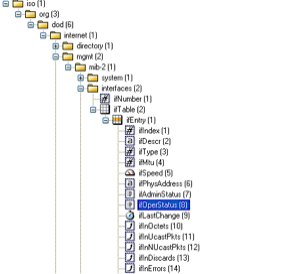
MIB organization example ilustration
In the illustration we can see how a MIB is organized; it is a hierarchical structure where within each “folder”, we have a series of directories and identifiers. In this MIB we can see what data we are going to obtain from the equipment, for example the interface speed, the state, the MTU, unicast packets …
Each data we can obtain is an OID and generally, they have a description of what type of data it is (numeric, text), what values can be received, etc …
In this way, the SNMP manager and the agent can exchange actionable information that help us manage and maintain a complex infrastructure with a multitude of services.
SNMP has evolved over the years and improved functionality and security. There are 3 versions of SNMP:
- SNMP v1: The first version of SNMP was defined in 1988. It is still in widespread use, mainly because it is much easier to use than the other versions. However, this version does not have any encryption. Therefore, it is recommended that SNMP v1 only be used on private networks that are not connected to the Internet.
- SNMP v2c: When people talk about version 2, it usually means SNMP v2c. However, this version also lacks encryption. A feature of SNMP v2c is that it supports 64-bit counters, while SNMP v1 only uses 32-bit.
- SNMP v3: the third and newest version of SNMP that supports encryption, significantly increases the security of monitoring via SNMP. However, the SNMP v3 setup is complex and laborious compared to its predecessors.
SNMP v1 and v2c are widespread for their ease of configuration. They use a plain text string to authenticate, this string is called community and it has to be the same in the manager and the agent. It is quite easy to intercept since all the information exchange is done in plain text.
SNMP v3 adds cryptography to its operation, so the data exchange is done by encrypting the information and authenticating by user / password or certificate. It uses TLS / DTLS.
CONCLUSION ON MONITORING
Infrastructure monitoring has become an essential tool for any company or business. The criticality of the services and applications nowadays, cannot afford to have drops or not be available to users.
Service outage times are measured in economic losses and the longer it takes us to detect and solve an incident, the greater losses are caused.
A monitoring system gives us the following advantages and benefits, since they are complex tools with the ability to perform a multitude of tasks:
- Make the most of HW resources and be able to have a long-term capacity plan.
- Incident prevention and problem detection.
- Save costs and time.
- Systems inventory.
- Graphics of performance, traffic, memory, CPU … anticipating any capacity issues
- Ease of managing large infrastructures with less staff.
- Detailed analysis of traffic using Netflow.
- Event and log correlation, through the use of syslog.
At Coreun we have a long experience in the implementation and configuration of different monitoring systems, adapted to the technical and economic needs of each client. You can check our NOC Services.